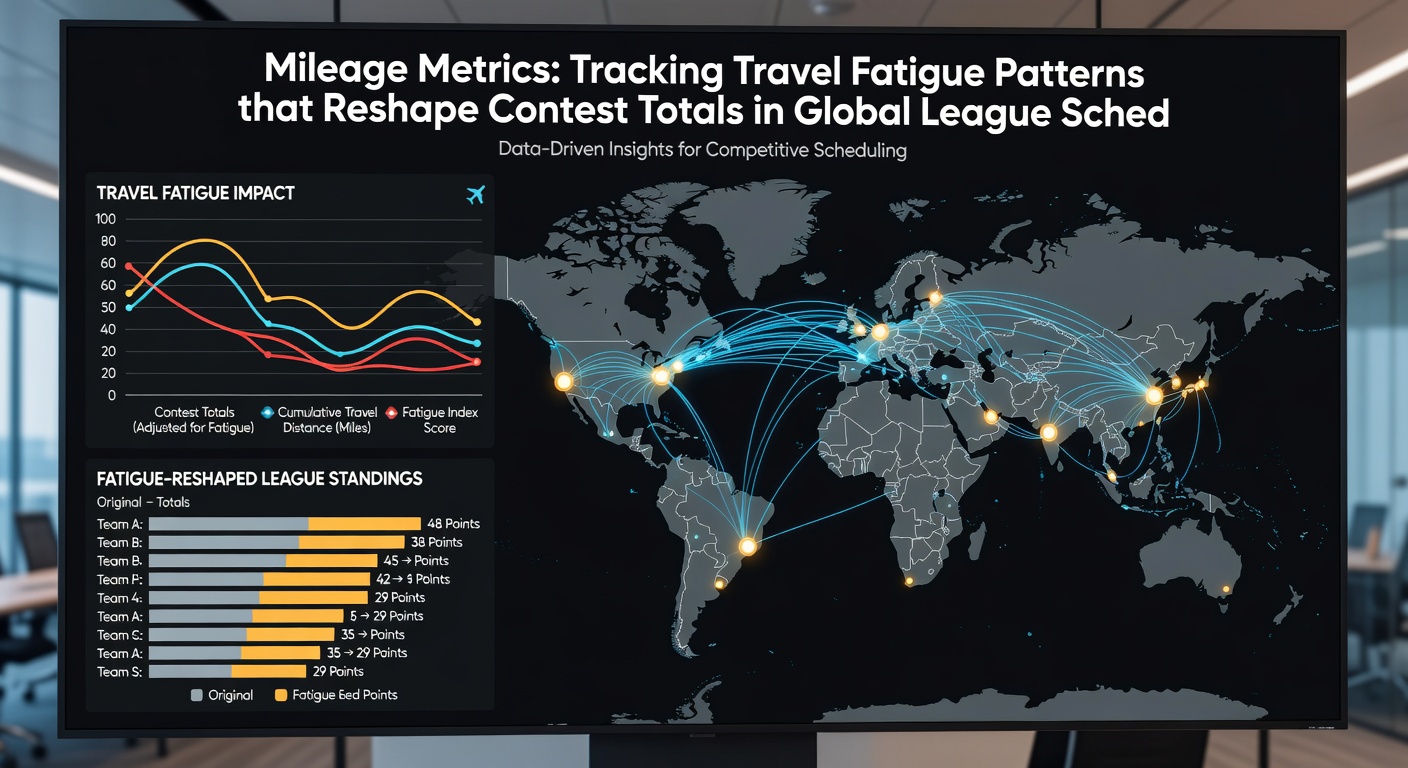
Mileage metrics: tracking travel fatigue patterns that reshape contest totals in global league schedules
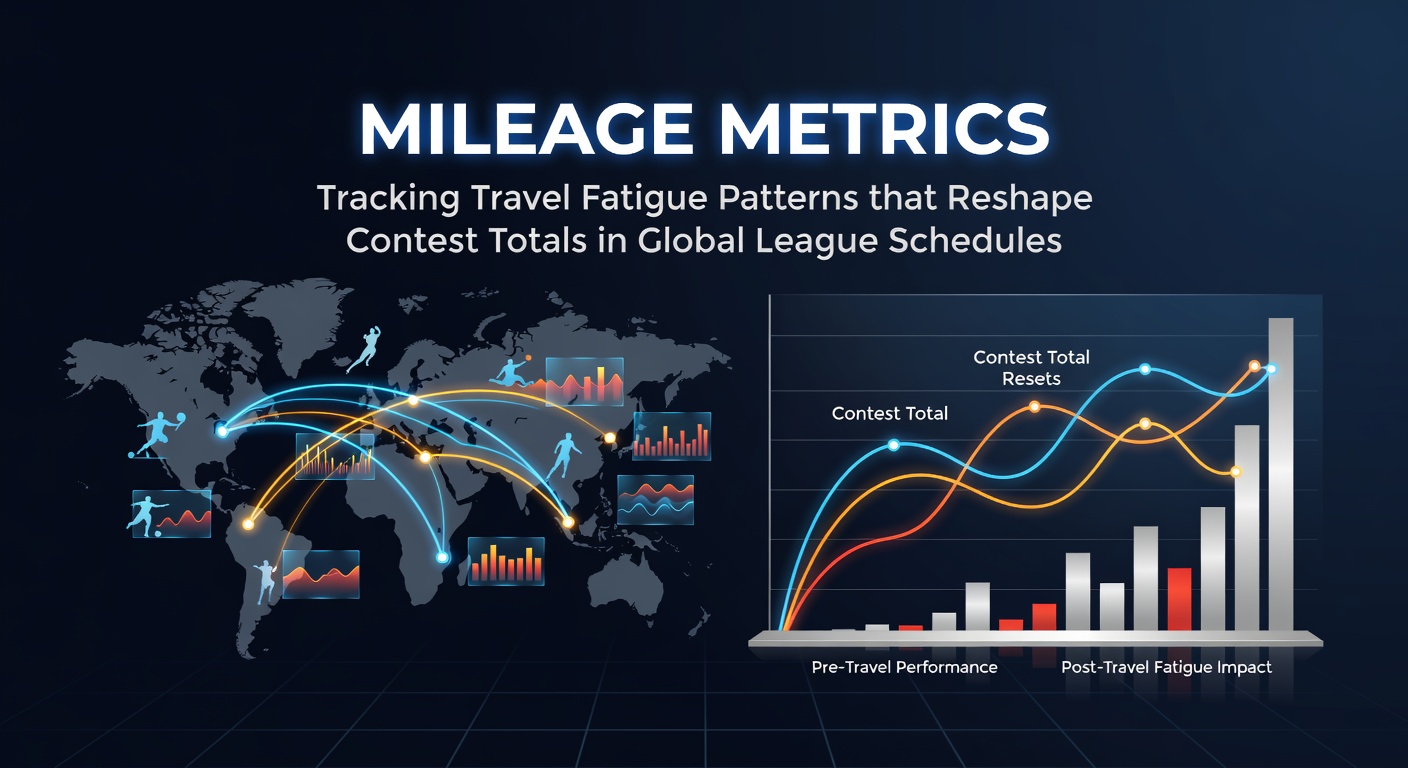
Travel distance and recovery time have become central factors in how analysts evaluate contest totals across major leagues, and data from multiple seasons shows consistent patterns where accumulated mileage correlates with shifts in scoring outputs. Researchers track flight hours, time zone changes, and back-to-back scheduling through specialized software that compiles player movement logs, then cross-reference those figures against box scores to identify when totals trend lower or higher than seasonal averages.
Global Schedule Pressures in 2026
June 2026 brings compressed timelines for several international competitions that overlap with domestic seasons, forcing clubs in soccer and basketball to manage extended trips between continents while maintaining regular league play. Observers note that European clubs participating in midweek fixtures followed by long-haul travel to South American or Asian tournaments often record reduced points per game in the subsequent domestic round, with totals dropping by margins that range from four to eight points in basketball equivalents and one to two goals in soccer. Similar trends appear in cricket, where Test and T20 schedules require rapid movement across time zones, and teams logging over 15,000 kilometers in a single month show measurable declines in run rates during the first two matches after arrival.
Data Collection Methods
Organizations such as the Australian Sports Commission compile mileage databases that integrate GPS tracking from training sessions with commercial flight records, allowing analysts to assign fatigue scores based on distance traveled, sleep disruption, and consecutive high-intensity days. These metrics feed into predictive models that adjust expected totals before contests, particularly when one side has logged significantly more air miles than its opponent in the prior ten days. League officials in North America apply comparable systems through partnerships with performance analytics firms, logging cumulative kilometers for NBA and NHL rosters to flag games where travel load exceeds established thresholds.
Impact on Scoring Totals Across Sports
Studies examining five seasons of NBA data reveal that teams crossing three or more time zones before a game post averages 4.2 points lower than their season mean, while opponents benefit from home rest and post higher combined totals in roughly 62 percent of such matchups. Soccer research conducted by European performance institutes shows parallel effects, with away sides traveling over 4,000 kilometers in the preceding week generating 0.8 fewer goals per match on average, a pattern that holds across multiple top divisions. In cricket, limited-overs fixtures following intercontinental travel produce run totals that fall below projected lines in 55 percent of cases during the opening overs, according to figures compiled by national cricket boards.
Analysts adjust contest totals by layering mileage data onto traditional form indicators, creating weighted projections that account for recovery windows between matches. When both participants face elevated travel loads, totals often compress further because defensive execution remains intact while offensive efficiency declines, a dynamic documented in multiple league reports. Conversely, when only one side carries heavy mileage, the rested opponent frequently exploits the gap, pushing totals upward as the fresher team controls tempo and generates more scoring opportunities.
Case Examples from Recent Cycles
One documented sequence in the 2025-26 NBA season involved a Western Conference team completing a three-game road swing that covered 12,000 kilometers across five days, after which its next home contest produced a total 11 points below the posted line. Similar instances appear in European soccer, where clubs returning from Copa Libertadores or AFC Champions League engagements record lower goal outputs in domestic league fixtures the following weekend. Cricket boards tracking IPL and international schedules note comparable dips when franchises complete back-to-back overseas legs before returning to home venues.
Technological Integration and Future Tracking
Advanced platforms now combine wearable device output with schedule databases to generate real-time fatigue indices that update as travel plans finalize. These systems allow schedulers and analysts to identify potential total shifts days in advance, particularly during periods such as June 2026 when overlapping tournaments increase the frequency of long-distance movements. The approach relies on aggregated historical data rather than individual player variables, ensuring models remain stable across large sample sizes while still capturing league-wide patterns in scoring behavior.
Conclusion
Mileage tracking continues to refine how contest totals are evaluated across global leagues, with evidence from multiple sports confirming that accumulated travel distance influences scoring outputs in measurable ways. Organizations maintain expanding datasets that link flight logs to performance metrics, supporting ongoing adjustments to projections as schedules evolve through 2026 and beyond.