Mapping Venue-Specific Factors That Drive Pre-Event Line Adjustments in Football Fixtures and Horse Racing Meets
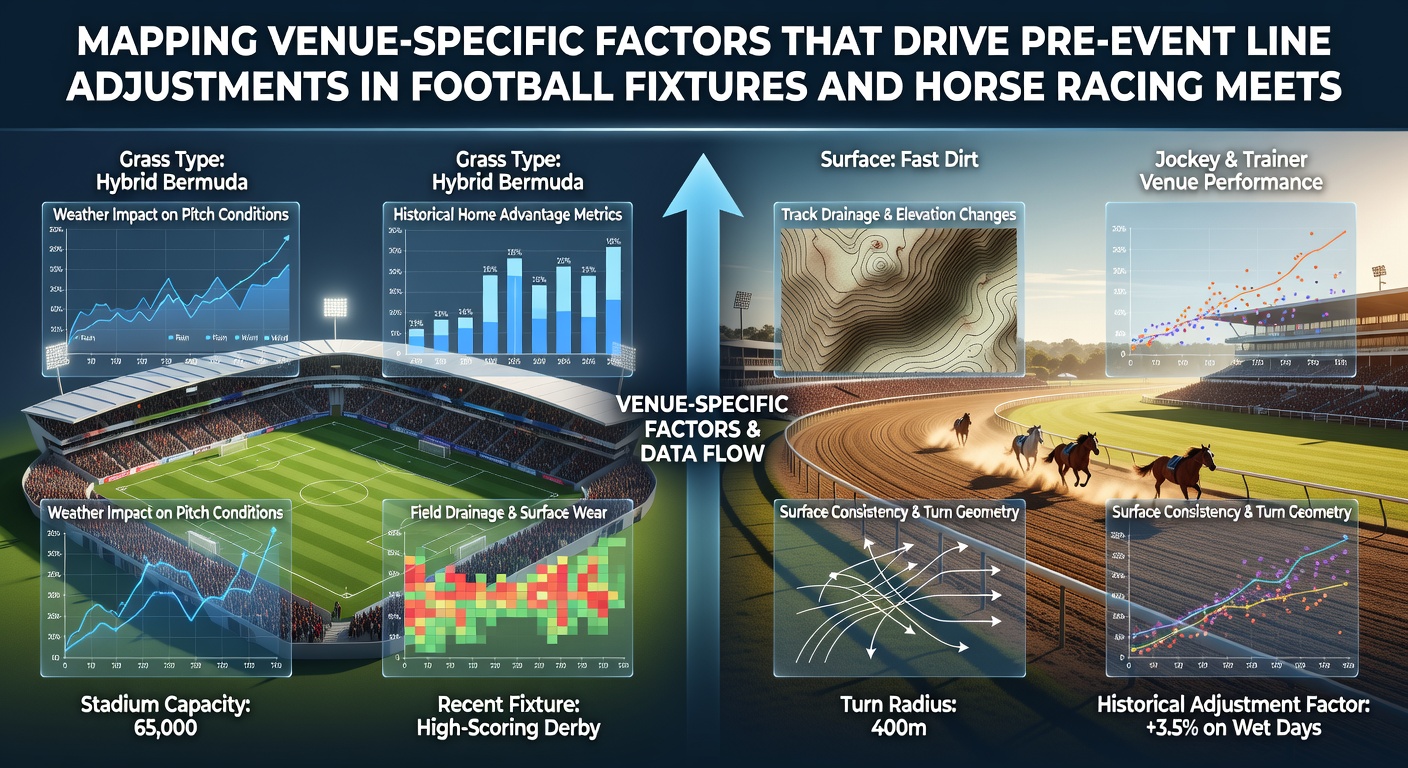
Venue characteristics shape pre-event betting lines in both football fixtures and horse racing meets because operators incorporate location-specific data into their models long before kickoff or the first race. Observers note that these adjustments arise from measurable elements such as pitch dimensions, surface composition, elevation, historical performance records, and prevailing weather patterns at each site, and the process continues through early June 2026 as fixtures and meetings approach.
Core Venue Elements in Football
Football stadiums present distinct variables that prompt line recalibrations, and researchers at institutions including the University of Loughborough have documented how pitch length and width influence expected goal totals and possession statistics across multiple leagues. When a ground features narrower dimensions, teams accustomed to wider spaces often record lower shot volumes, which leads operators to tighten over/under thresholds by several tenths of a goal. Altitude adds another layer, and data collected at high-elevation venues shows visiting sides concede more set-piece opportunities because reduced oxygen levels accelerate fatigue during the second half.
Crowd density and acoustic properties also register in the models, because stadiums with steep stands amplify noise and correlate with higher home-team conversion rates on crosses. Bookmakers integrate attendance forecasts and historical decibel readings from comparable fixtures, then shift handicap margins accordingly before the teams arrive for final training sessions.
Track and Surface Variables in Horse Racing
Horse racing meets rely on track geometry and surface conditions that operators monitor through official reports issued by bodies such as the Australian Racing Board and state-level regulators. Rail position, for example, determines the length of the home straight and the severity of any camber, factors that repeatedly alter win probabilities for front-running versus hold-up horses. When the rail moves inward on a particular circuit, horses drawn in lower stalls gain measurable ground, prompting adjustments to place and each-way lines several days in advance.
Going descriptions further refine those calculations, because turf moisture content changes stride length and stamina requirements, and operators cross-reference soil readings with long-term performance databases for each trainer and jockey combination at that course. June meetings often coincide with seasonal transitions in ground conditions, and analysts incorporate rainfall projections released by meteorological services to fine-tune morning line odds before declarations close.
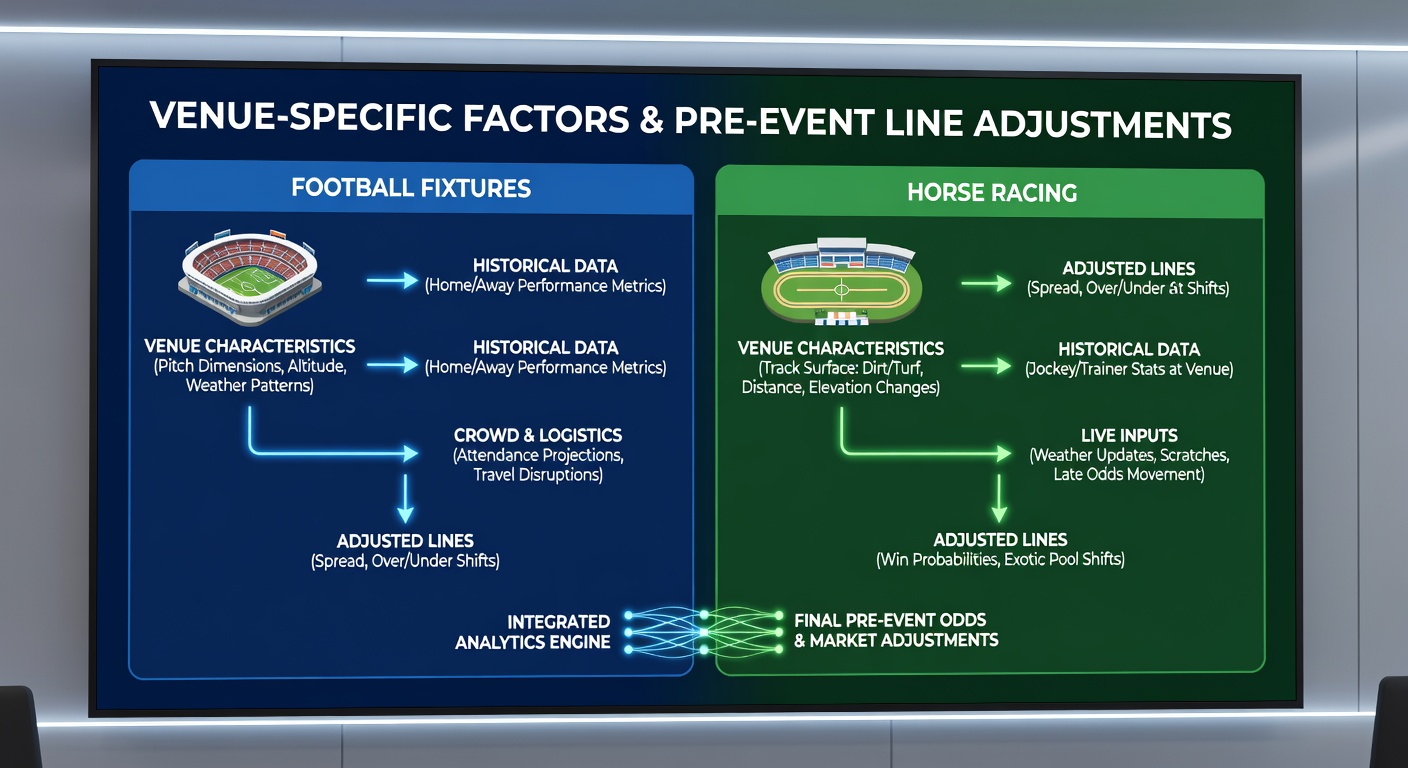
Comparative Data Integration Across Both Sports
Operators employ parallel methodologies when mapping these venue factors, drawing on geographic information systems that layer satellite imagery, elevation models, and historical results into unified databases. A study published by the European Association for Sports Management examined how such layered data sets reduce variance in pre-event totals across football and racing, and the findings showed consistent shrinkage in line movement once venue-specific coefficients enter the pricing algorithms.
Weather overlays provide an additional common thread, because both sports experience direct effects from wind speed, temperature, and precipitation, yet the translation into odds differs by event type. Football lines respond primarily through expected goal suppression on heavy pitches, whereas racing operators adjust time-based ratings and draw biases when persistent rain alters the going from good to soft. Regulatory filings from the Nevada Gaming Control Board indicate that operators file updated liability reports whenever venue-driven shifts exceed defined thresholds, ensuring transparency in the days leading up to major meetings.
Practical Application and Reporting Cycles
Pre-event line teams follow structured calendars that begin weeks before an event, and they refresh venue profiles whenever new ground surveys or pitch renovation reports become available. In June 2026, several high-profile football derbies and summer racing festivals will test these systems under varying daylight and temperature conditions, prompting incremental tweaks to opening odds as fresh meteorological and surface data arrive. The same teams also monitor travel logistics, because long-haul journeys to remote venues correlate with measurable drops in away-team performance metrics that operators factor into handicap calculations.
Conclusion
Venue-specific mapping therefore operates as a continuous, data-driven process that links physical characteristics of stadiums and racetracks to observable shifts in pre-event betting lines across football and horse racing. Observers record these adjustments through public odds histories and regulatory disclosures, confirming that location remains a primary input rather than an afterthought in the pricing sequence.