How Travel Fatigue Alters Betting Lines for Back-to-Back Fixtures in Tennis Tours and Basketball Seasons
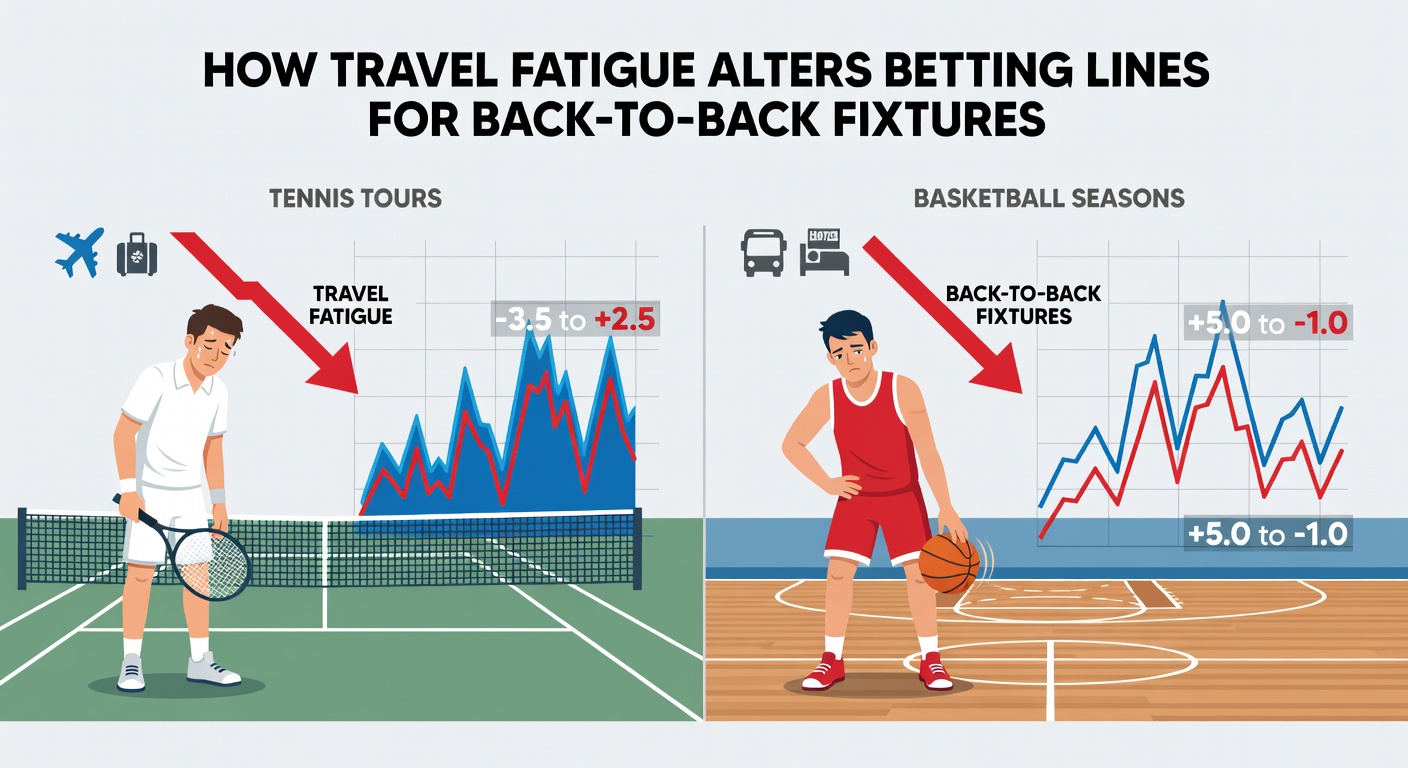
Travel fatigue emerges as a measurable factor that influences player performance across extended schedules in professional tennis and basketball, and bookmakers respond by adjusting lines accordingly for consecutive matches. Data collected from multiple seasons shows that athletes crossing time zones or enduring overnight flights exhibit reduced recovery times, which translates into shifts in point spreads, totals, and player props. Observers tracking these patterns note consistent adjustments in markets whenever fixtures cluster within 24 to 48 hours of significant travel.
Patterns in Tennis Scheduling
ATP and WTA calendars frequently place players in back-to-back events that require rapid relocation between continents, and researchers examining match outcomes have documented corresponding dips in first-serve percentages and rally endurance after such journeys. A study published in the Journal of Sports Sciences tracked over 200 tournament participants and found average declines of 8 percent in serve accuracy following flights exceeding eight hours. These performance metrics prompt oddsmakers to widen or narrow spreads on upcoming matches, particularly when a top seed faces a local opponent who avoided similar transit demands. In June 2026, the European swing leading into grass-court events illustrates this dynamic, with several high-profile players arriving from Asia-Pacific stops and seeing their implied probabilities adjusted downward in early markets.
Basketball Travel and Consecutive Games
NBA schedules incorporate back-to-backs at a rate exceeding 20 percent of regular-season contests, and travel between distant arenas compounds the physical toll according to league medical reports. Teams logging more than 1,500 miles between games show measurable reductions in fourth-quarter efficiency, with field-goal percentages dropping by margins that range from 4 to 7 points per contest. Sportsbooks integrate these historical figures into their models, producing totals that trend lower when both participants arrive via cross-country routes. Analysts reviewing 2025-2026 season data observed that Eastern Conference squads traveling westward for consecutive nights encountered totals lowered by an average of 3.5 points compared with home-heavy stretches.
Market Adjustments and Line Movement
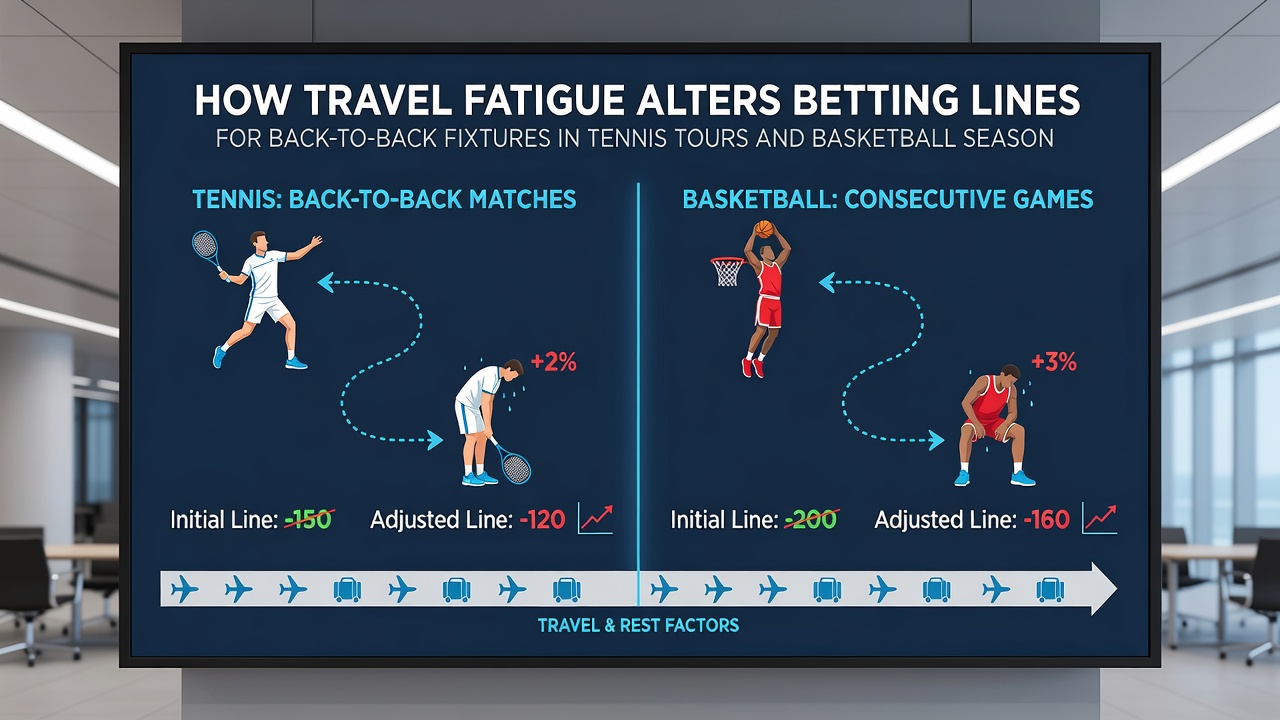
Betting operators monitor flight manifests, recovery windows, and historical splits to recalibrate odds, and this process generates visible movement in the hours preceding tip-off or first serve. When fatigue indicators align with statistical trends, moneylines shift by 15 to 25 basis points while over-under figures compress or expand depending on the sport. In tennis, sets extending beyond 10 games become less probable after long-haul travel, prompting live markets to favor quicker resolutions. Basketball totals similarly contract when both clubs have logged heavy mileage, as defensive schemes hold up longer under reduced offensive output. Figures released by the Australian Institute of Sport confirm that circadian disruption lasting more than two days correlates with elevated error rates in precision tasks such as free-throw shooting and return placement.
Regional Examples and Scheduling Clusters
North American basketball teams face amplified effects during Western Conference road trips that string together multiple time-zone changes, whereas European tennis circuits produce shorter but more frequent transitions between indoor and outdoor venues. Data compiled across both leagues reveals that the second contest in any back-to-back sequence carries a higher variance in expected outcomes, which oddsmakers reflect through wider vig or adjusted totals. During June 2026, overlapping tennis and basketball events in North America and Europe created simultaneous windows where fatigue modeling influenced multiple markets within the same calendar week. Those patterns repeat annually because governing bodies publish fixed calendars that rarely accommodate extra rest days after transcontinental legs.
Data Integration by Operators
Bookmakers incorporate satellite tracking, sleep-monitoring studies, and performance databases to refine their algorithms, and the resulting lines demonstrate tighter correlations with actual results than static models that ignore transit variables. A report issued by the European Sports Medicine Association quantified recovery deficits after red-eye flights and supplied quantitative thresholds used by several major operators. These inputs allow markets to price in fatigue before public betting volume arrives, producing opening lines that already embed expected decrements in efficiency. Subsequent movement then reflects public perception versus the underlying data, creating temporary inefficiencies that close rapidly once sharper action enters.
Conclusion
Travel fatigue registers as a quantifiable variable that systematically influences betting lines for back-to-back fixtures in tennis tours and basketball seasons. Performance databases, flight records, and recovery studies supply the inputs operators use to set and adjust odds, and the resulting markets reflect documented patterns rather than speculation. Observers tracking both sports continue to monitor how scheduling clusters and geographic demands shape outcomes across future seasons.