Correlating Injury Reports with Subsequent Odds Fluctuations in Professional Leagues
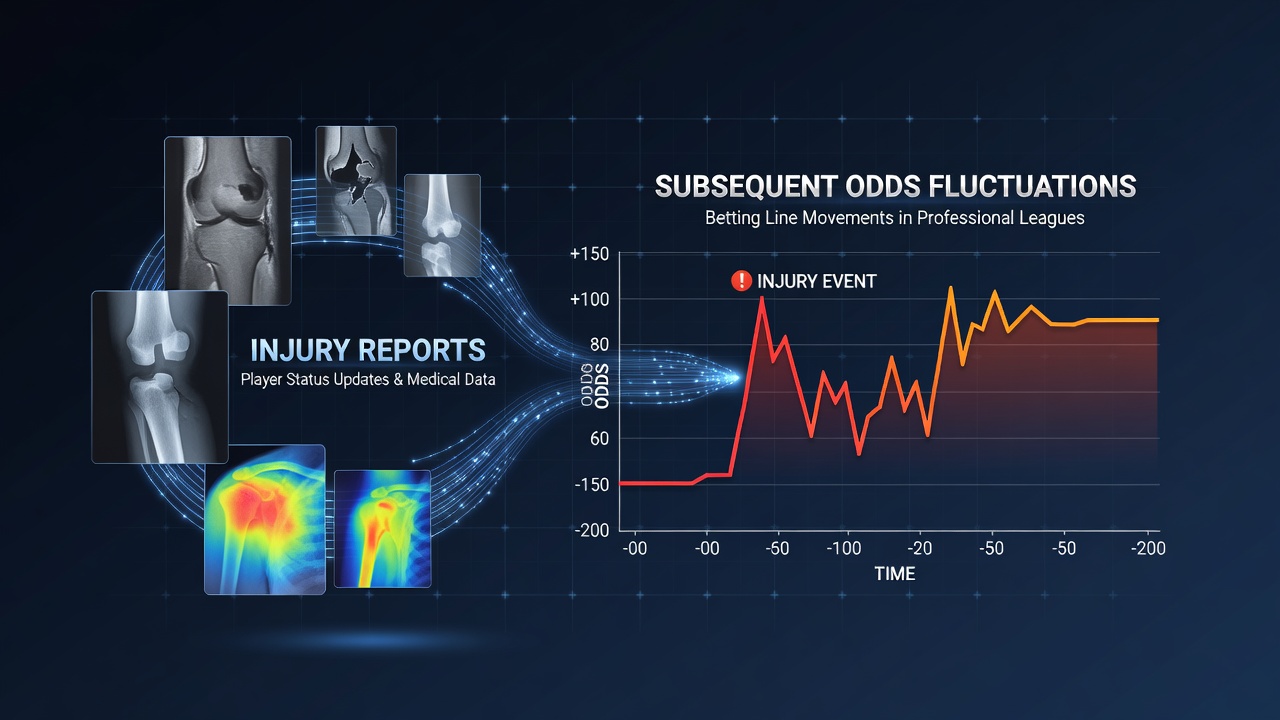
Professional sports leagues release injury reports on set schedules, and those announcements often trigger measurable shifts in betting odds across major markets, while bookmakers recalibrate lines based on player availability data that arrives from team medical staffs and league offices. Observers note that the timing and specificity of these reports create predictable windows where odds move in response to confirmed absences or returns, and data from multiple seasons shows how markets react within minutes of updates.
League-Specific Reporting Protocols Shape Market Reactions
NBA teams submit injury reports hours before tip-off, yet the NFL requires more detailed designations by Friday afternoons during game weeks, and soccer leagues in Europe follow variable patterns depending on domestic federation rules, whereas cricket boards in Australia and India issue updates tied to match-day squad announcements. Researchers tracking these differences have documented that tighter reporting windows in basketball produce sharper odds swings compared to the steadier adjustments seen in football, because bettors receive less advance notice when key contributors are ruled out.
Studies conducted by academic groups in the United States indicate that confirmed absences of star players correlate with average line movements of 1.5 to 3 points in NBA totals markets, and similar patterns appear in goal totals for soccer matches when central defenders or goalkeepers are sidelined. Those same analyses reveal that partial participation tags, such as questionable or probable designations, generate smaller but still detectable fluctuations that accumulate across betting exchanges.
Timing of Reports and Subsequent Odds Adjustments
Bookmakers monitor official league feeds alongside social media signals from verified team accounts, and they often adjust moneylines and point spreads within seconds of verified reports hitting public channels. In June 2026, for instance, several NBA playoff games saw rapid line movement after late-afternoon injury designations emerged, with spreads shifting by as much as four points when starting guards were downgraded to out status.
Canadian regulatory reports from the Alcohol and Gaming Commission of Ontario have tracked how injury-related odds changes affect handle volumes, and those figures show elevated betting activity in the hour following report releases compared to quiet periods. European data from the Malta Gaming Authority similarly records spikes in live betting turnover when midweek soccer injury news surfaces, particularly for Champions League fixtures where squad depth varies widely.
Quantifying the Correlation Through Historical Datasets
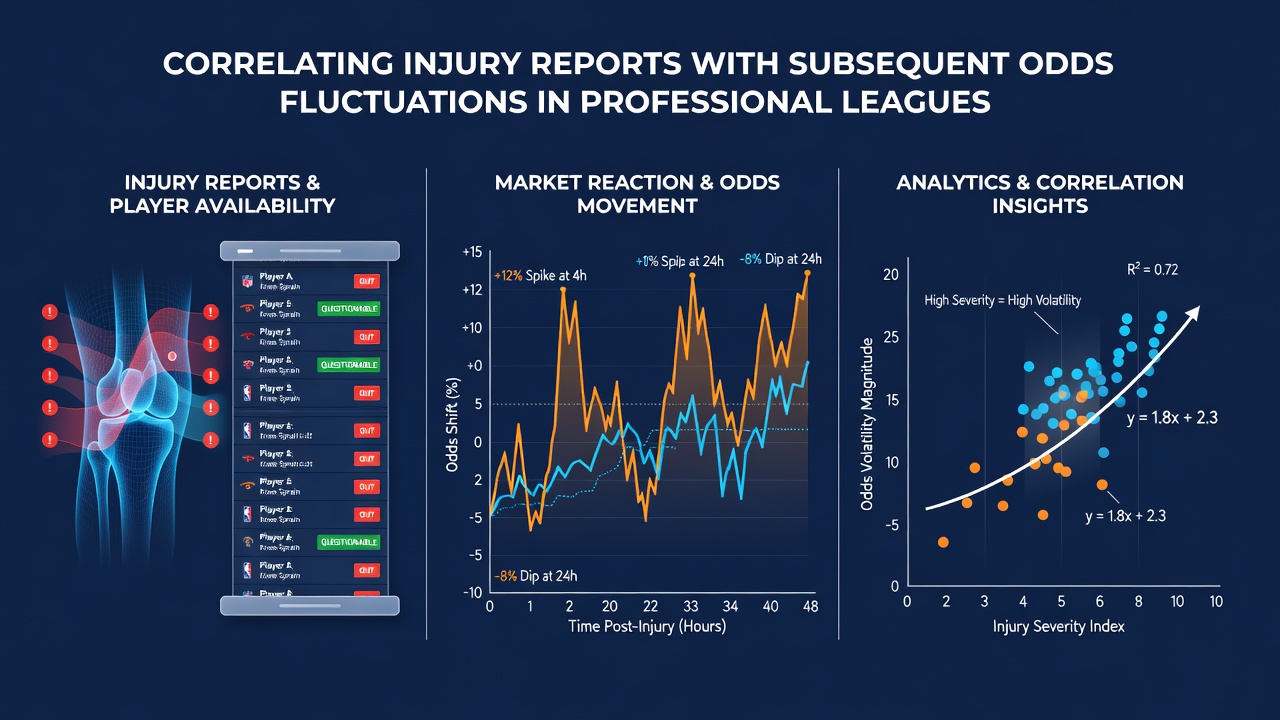
Statistical models built from multi-year datasets demonstrate moderate to strong correlations between the severity of reported injuries and the magnitude of odds movement, although confounding variables such as weather, travel schedules, and opponent strength dilute the relationship in certain contexts. Analysts at research institutions including the University of Nevada, Las Vegas have published papers showing that the correlation coefficient between star player injury announcements and pre-game totals movement hovers around 0.65 across NBA and NFL samples, while soccer leagues display slightly lower coefficients near 0.55 because of larger roster sizes.
Those models also highlight that the direction of movement remains consistent in most cases, with betting lines moving against teams losing key personnel and toward opponents who gain relative advantage. Yet exceptions occur when replacement players exceed expectations or when the injured athlete's role proves less central than initially assumed by oddsmakers.
Additional Variables That Interact with Injury Data
Public betting trends and sharp money flows frequently amplify or dampen the initial reaction to injury reports, and syndicates often place large wagers immediately after reports surface, which accelerates line movement beyond what the injury alone might justify. League policies around report accuracy further influence outcomes, because fines for inaccurate submissions encourage teams to provide conservative early designations that later get revised.
Cross-sport comparisons reveal that cricket and tennis produce distinct patterns because those individual and small-unit formats allow injuries to a single performer to swing match odds more dramatically than in team-heavy environments like basketball or baseball. Data aggregators that compile these movements across platforms allow observers to identify recurring thresholds where injury severity reliably exceeds typical variance levels.
Conclusion
Correlations between injury reports and odds fluctuations continue to evolve as leagues refine reporting standards and as data collection improves through integrated tracking systems, while researchers across multiple continents keep documenting how these inputs interact with broader market dynamics. The patterns remain measurable and repeatable across seasons, offering structured insight into how professional sports betting lines respond to verified player availability changes.